Kubernetes on OpenStack
Kubernetes cluster can run on OpenStack. One of the many options is to use Rancher Kubernetes Engine. In this demo, we will explore capabilities of Kubernetes with an simple example slightly beyond “Hello World”. We use Kubernetes to create a StatefulSet of NGINX pods. The system has fail-over protection and disaster recovery built in. The web content is stored in a S3 bucket as web servers in clouds would normally do.
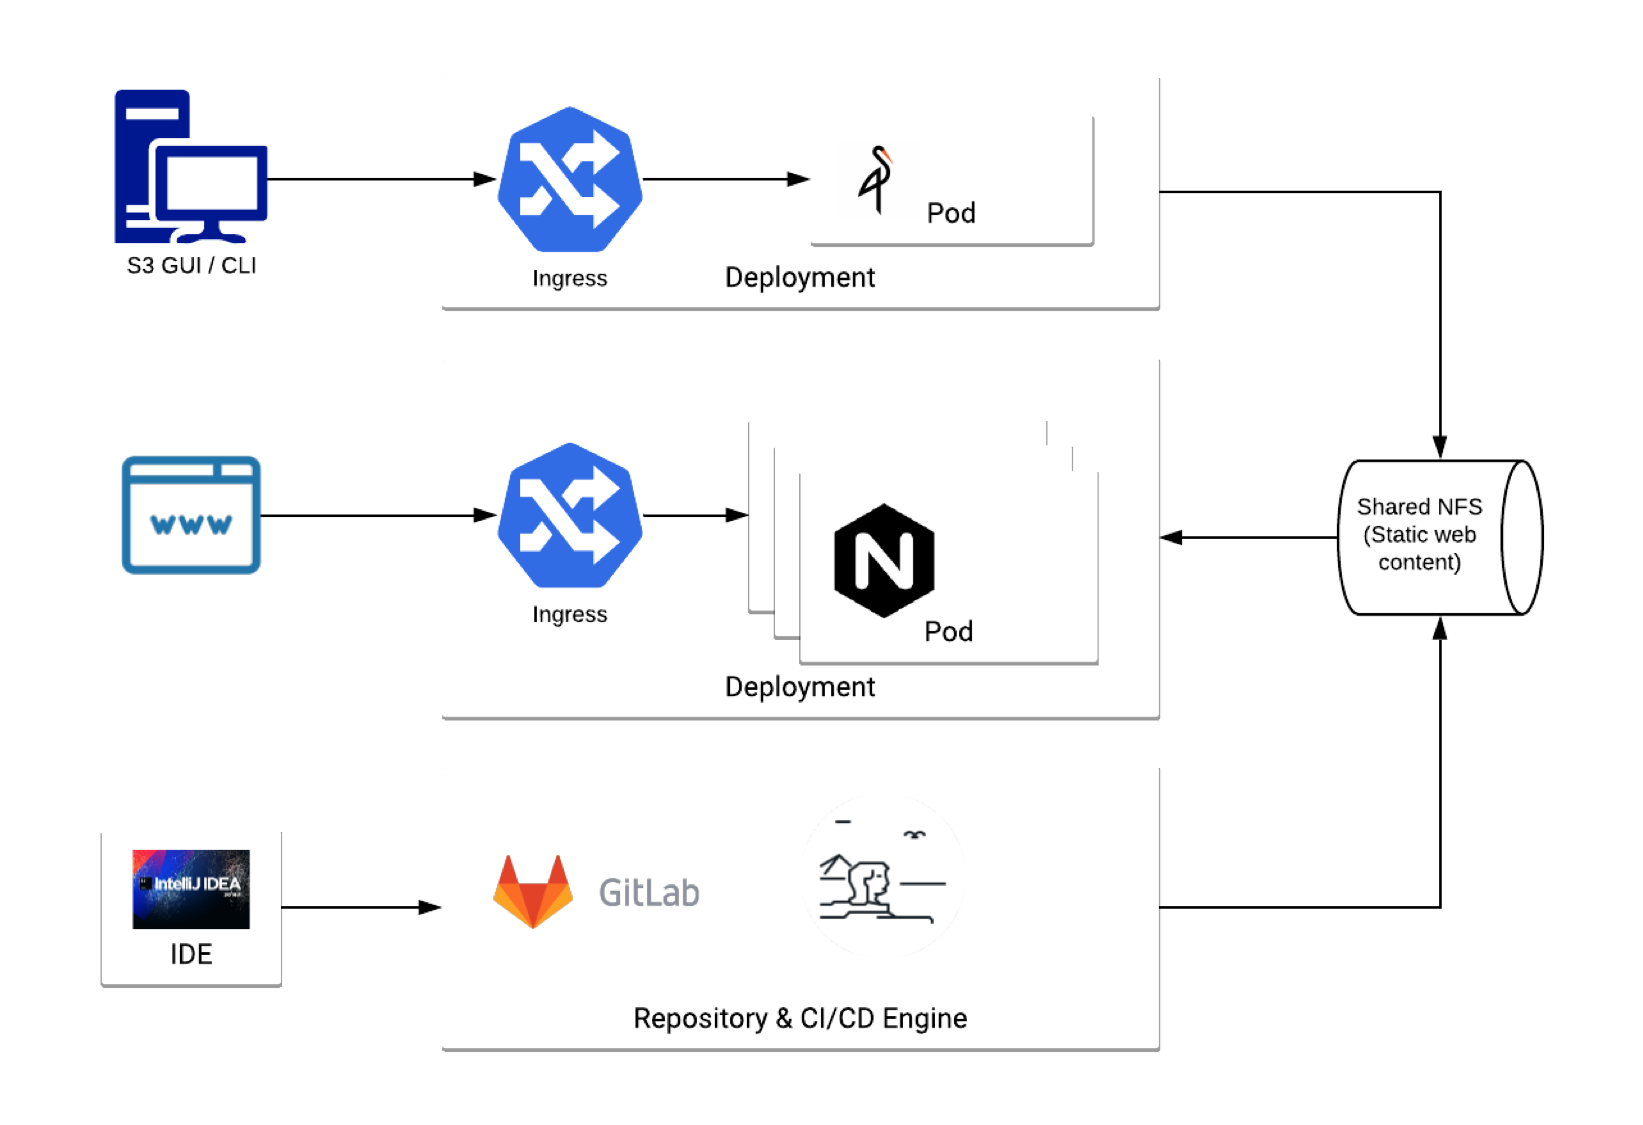
Figure: NGINX, NFS and Minio integration
In particular, we will discuss items 1 - 4 and leave items 5 - 7 as reading after the workshop:
- Credentials and Floating IP [FIP] - Accessing a newly created K8S cluster.
- Kubectl - Interacting with the cluster with CLI
- Kubernetes Dashboard - Interacting with the cluster with GUI
- Prometheus and Grafana - Monitoring the cluster with GUI
- Application for web (NGINX) - Creating NGINX service via StatefulSet, including: Service, StatefulSet, Ingress & private or shared NFS volumes
- Data Loading via S3 (Minio) - Loading data with Minio GUI into a new NFS volume
- End-to-end: integrating NGINX, NFS and Minio - How everything works together to form a basic system below:
Credentials and Floating IP [FIP]
If a Kubernetes cluster is created on Rancher Kubernetes Engine, it will generate the configuration of the new cluster as a kube.yml file. It is a good idea to rename and to move it to ~/.kube following general convention. You may find that you have multiple configure files already with the default named config. I have moved my ./kube.yml to ~/.kube/oskconfig:
C02XD1G9JGH7:tsi-ccdoc davidyuan$ cd ~/.kube
C02XD1G9JGH7:.kube davidyuan$ ls -l
total 160
drwxr-xr-x    3 davidyuan  384566875     96 Dec 20 10:42 cache
-rw-------    1 davidyuan  384566875  68200 Apr 29 10:46 config
-rw-r--r--    1 davidyuan  384566875   1872 Feb 23 17:12 eksconfig
drwxr-xr-x  667 davidyuan  384566875  21344 May 10 17:04 http-cache
-rw-r--r--    1 davidyuan  384566875   5387 May 10 15:38 oskconfig
C02XD1G9JGH7:.kube davidyuan$
Manipulate KUBECONFIG so that you do not have to use –kubeconfig kube.yml in every kubectl command. For example, update ~/.bash_profile with the following:
export KUBECONFIG=~/.kube/oskconfig:~/.kube/config
After restarting bash session or reloading ~/.bash_profile, you should see the contexts are merged with the new configuration local local kube-admin-local as the current context:
C02XD1G9JGH7:~ davidyuan$ kubectl config get-contexts
CURRENT   NAME                                                  CLUSTER                                               AUTHINFO                                              NAMESPACE
          aks-ebi1                                              aks-ebi1                                              clusterUser_uksouth_aks-ebi1
          arn:aws:eks:eu-north-1:871979166454:cluster/k8s-eks   arn:aws:eks:eu-north-1:871979166454:cluster/k8s-eks   arn:aws:eks:eu-north-1:871979166454:cluster/k8s-eks
          arn:aws:eks:eu-north-1:871979166454:cluster/tsi       arn:aws:eks:eu-north-1:871979166454:cluster/tsi       arn:aws:eks:eu-north-1:871979166454:cluster/tsi
          cyclecloud                                            cyclecloud                                            clusterUser_uksouth_cyclecloud
          euwest1c.4ebi.uk                                      euwest1c.4ebi.uk                                      euwest1c.4ebi.uk
*         local                                                 local                                                 kube-admin-local
          ucp_hh-ucp.caas.ebi.ac.uk:6443_davidyuan              ucp_hh-ucp.caas.ebi.ac.uk:6443_davidyuan              ucp_hh-ucp.caas.ebi.ac.uk:6443_davidyuan
          ucp_hx-ucp.caas.ebi.ac.uk:6443_davidyuan              ucp_hx-ucp.caas.ebi.ac.uk:6443_davidyuan              ucp_hx-ucp.caas.ebi.ac.uk:6443_davidyuan
Note that you can use kubectl config use-context local to reset the current context. If you are working with multiple Kubernetes clusters in the same or different clouds, you always want to check and switch contexts with these two commands.
A floating IP is assigned to the new cluster for various endpoints. The value can be found in the config file or with the following command:
C02XD1G9JGH7:.kube davidyuan$ kubectl cluster-info
Kubernetes master is running at https://45.86.170.94:6443
CoreDNS is running at https://45.86.170.94:6443/api/v1/namespaces/kube-system/services/kube-dns:dns/proxy

To further debug and diagnose cluster problems, use 'kubectl cluster-info dump'.
Kubectl
Explore your new cluster to get familiar with it. With the following commands, you will have a fairly good idea what your cluster looks like. Here is my cluster when it was first created:
C02XD1G9JGH7:~ davidyuan$ kubectl get nodes
NAME           STATUS    ROLES               AGE       VERSION
192.168.0.12   Ready     worker              22h       v1.13.5
192.168.0.13   Ready     worker              22h       v1.13.5
192.168.0.14   Ready     worker              22h       v1.13.5
192.168.0.15   Ready     controlplane,etcd   22h       v1.13.5
192.168.0.16   Ready     controlplane,etcd   22h       v1.13.5
192.168.0.17   Ready     controlplane,etcd   22h       v1.13.5

C02XD1G9JGH7:~ davidyuan$ kubectl get svc --all-namespaces
NAMESPACE     NAME                                           TYPE        CLUSTER-IP      EXTERNAL-IP   PORT(S)                      AGE
default       kubernetes                                     ClusterIP   10.43.0.1       <none>        443/TCP                      22h
ingress       ingress-nginx-ingress-controller               NodePort    10.43.81.91     <none>        80:30000/TCP,443:30001/TCP   22h
ingress       ingress-nginx-ingress-controller-metrics       ClusterIP   10.43.73.90     <none>        9913/TCP                     22h
ingress       ingress-nginx-ingress-controller-stats         ClusterIP   10.43.142.79    <none>        18080/TCP                    22h
ingress       ingress-nginx-ingress-default-backend          ClusterIP   10.43.106.89    <none>        80/TCP                       22h
kube-system   kube-dns                                       ClusterIP   10.43.0.10      <none>        53/UDP,53/TCP                22h
kube-system   metrics-server                                 ClusterIP   10.43.200.136   <none>        443/TCP                      22h
kube-system   prometheus-operator-coredns                    ClusterIP   None            <none>        9153/TCP                     22h
kube-system   prometheus-operator-kube-controller-manager    ClusterIP   None            <none>        10252/TCP                    22h
kube-system   prometheus-operator-kube-etcd                  ClusterIP   None            <none>        2379/TCP                     22h
kube-system   prometheus-operator-kube-scheduler             ClusterIP   None            <none>        10251/TCP                    22h
kube-system   prometheus-operator-kubelet                    ClusterIP   None            <none>        10250/TCP                    22h
kube-system   tiller-deploy                                  ClusterIP   10.43.73.6      <none>        44134/TCP                    22h
monitoring    alertmanager-operated                          ClusterIP   None            <none>        9093/TCP,6783/TCP            22h
monitoring    prometheus-operated                            ClusterIP   None            <none>        9090/TCP                     22h
monitoring    prometheus-operator-alertmanager               ClusterIP   10.43.172.51    <none>        9093/TCP                     22h
monitoring    prometheus-operator-grafana                    ClusterIP   10.43.15.32     <none>        80/TCP                       22h
monitoring    prometheus-operator-grafana-custom             NodePort    10.43.205.187   <none>        3000:30002/TCP               22h
monitoring    prometheus-operator-kube-state-metrics         ClusterIP   10.43.167.241   <none>        8080/TCP                     22h
monitoring    prometheus-operator-operator                   ClusterIP   10.43.201.240   <none>        8080/TCP                     22h
monitoring    prometheus-operator-prometheus                 ClusterIP   10.43.118.118   <none>        9090/TCP                     22h
monitoring    prometheus-operator-prometheus-custom          NodePort    10.43.21.250    <none>        9090:30986/TCP               22h
monitoring    prometheus-operator-prometheus-node-exporter   ClusterIP   10.43.179.232   <none>        9100/TCP                     22h

C02XD1G9JGH7:~ davidyuan$ kubectl get pod --all-namespaces
NAMESPACE     NAME                                                      READY     STATUS      RESTARTS   AGE
default       listening-skunk-nfs-client-provisioner-79fb65dd79-86qgq   1/1       Running     0          22h
ingress       ingress-nginx-ingress-controller-f5cc4968f-nkb9d          1/1       Running     0          22h
ingress       ingress-nginx-ingress-default-backend-7965478b7-6jnwk     1/1       Running     0          22h
kube-system   canal-5frl6                                               2/2       Running     0          22h
kube-system   canal-7k8pp                                               2/2       Running     0          22h
kube-system   canal-dk44m                                               2/2       Running     0          22h
kube-system   canal-lk4sz                                               2/2       Running     0          22h
kube-system   canal-msmtf                                               2/2       Running     0          22h
kube-system   canal-xw6v4                                               2/2       Running     0          22h
kube-system   kube-dns-58bd5b8dd7-djlth                                 3/3       Running     0          22h
kube-system   kube-dns-58bd5b8dd7-kx6ls                                 3/3       Running     0          22h
kube-system   kube-dns-autoscaler-77bc5fd84-5qhb2                       1/1       Running     0          22h
kube-system   metrics-server-58bd5dd8d7-qjkn4                           1/1       Running     0          22h
kube-system   rke-kube-dns-addon-deploy-job-bxdht                       0/1       Completed   0          22h
kube-system   rke-metrics-addon-deploy-job-62kdt                        0/1       Completed   0          22h
kube-system   rke-network-plugin-deploy-job-5ql57                       0/1       Completed   0          22h
kube-system   tiller-deploy-5f4fc5bcc6-tpcps                            1/1       Running     0          22h
monitoring    alertmanager-prometheus-operator-alertmanager-0           2/2       Running     0          22h
monitoring    prometheus-operator-grafana-d6c4c5bb-vbg72                2/2       Running     0          22h
monitoring    prometheus-operator-kube-state-metrics-79f476bff6-hlk9p   1/1       Running     0          22h
monitoring    prometheus-operator-operator-55c67c5d64-hcx92             1/1       Running     0          22h
monitoring    prometheus-operator-prometheus-node-exporter-99mp6        1/1       Running     0          22h
monitoring    prometheus-operator-prometheus-node-exporter-h6tkt        1/1       Running     0          22h
monitoring    prometheus-operator-prometheus-node-exporter-l4ggc        1/1       Running     0          22h
monitoring    prometheus-prometheus-operator-prometheus-0               3/3       Running     1          22h

C02XD1G9JGH7:~ davidyuan$ kubectl get pv
NAME                                       CAPACITY   ACCESS MODES   RECLAIM POLICY   STATUS    CLAIM                                                                                                         STORAGECLASS   REASON    AGE
pvc-00183ff4-7318-11e9-9f21-fa163ebf1f8e   50Gi       RWO            Delete           Bound     monitoring/prometheus-prometheus-operator-prometheus-db-prometheus-prometheus-operator-prometheus-0           nfs-client               22h
pvc-fc23cc6b-7317-11e9-9f21-fa163ebf1f8e   20Gi       RWO            Delete           Bound     monitoring/alertmanager-prometheus-operator-alertmanager-db-alertmanager-prometheus-operator-alertmanager-0   nfs-client               22h

C02XD1G9JGH7:~ davidyuan$ kubectl get storageclass
NAME         PROVISIONER                                            AGE
nfs-client   cluster.local/listening-skunk-nfs-client-provisioner   22h

C02XD1G9JGH7:~ davidyuan$ kubectl get statefulset --all-namespaces
NAMESPACE    NAME                                            READY     AGE
monitoring   alertmanager-prometheus-operator-alertmanager   1/1       22h
monitoring   prometheus-prometheus-operator-prometheus       1/1       22h

C02XD1G9JGH7:~ davidyuan$ kubectl get replicaset --all-namespaces
NAMESPACE     NAME                                                DESIRED   CURRENT   READY     AGE
default       listening-skunk-nfs-client-provisioner-79fb65dd79   1         1         1         22h
ingress       ingress-nginx-ingress-controller-f5cc4968f          1         1         1         22h
ingress       ingress-nginx-ingress-default-backend-7965478b7     1         1         1         22h
kube-system   kube-dns-58bd5b8dd7                                 2         2         2         22h
kube-system   kube-dns-autoscaler-77bc5fd84                       1         1         1         22h
kube-system   metrics-server-58bd5dd8d7                           1         1         1         22h
kube-system   tiller-deploy-5f4fc5bcc6                            1         1         1         22h
monitoring    prometheus-operator-grafana-d6c4c5bb                1         1         1         22h
monitoring    prometheus-operator-kube-state-metrics-79f476bff6   1         1         1         22h
monitoring    prometheus-operator-operator-55c67c5d64             1         1         1         22h
Kubernetes Dashboard
Kubernetes dashboard is very handy, especially for new users. The commands in the section of Kubectl can be replaced by single-button clicks in the dashboard. Following the instructions to create dashboard, admin-user, access token for the dashboard, and finally enable proxy in background:
C02XD1G9JGH7:.kube davidyuan$ kubectl apply -f https://github.com/kubernetes/dashboard/raw/master/aio/deploy/recommended.yaml
namespace/kubernetes-dashboard created
serviceaccount/kubernetes-dashboard created
service/kubernetes-dashboard created
secret/kubernetes-dashboard-certs created
secret/kubernetes-dashboard-csrf created
secret/kubernetes-dashboard-key-holder created
configmap/kubernetes-dashboard-settings created
role.rbac.authorization.k8s.io/kubernetes-dashboard created
clusterrole.rbac.authorization.k8s.io/kubernetes-dashboard created
rolebinding.rbac.authorization.k8s.io/kubernetes-dashboard created
clusterrolebinding.rbac.authorization.k8s.io/kubernetes-dashboard created
deployment.apps/kubernetes-dashboard created
service/dashboard-metrics-scraper created
deployment.apps/dashboard-metrics-scraper created

C02XD1G9JGH7:.kube davidyuan$ kubectl apply -f https://gitlab.ebi.ac.uk/TSI/tsi-ccdoc/raw/external/tsi-cc/ResOps/scripts/k8s-dashboard/admin-user.yml
serviceaccount/admin-user created
clusterrolebinding.rbac.authorization.k8s.io/admin-user created

C02XD1G9JGH7:.kube davidyuan$ kubectl -n kubernetes-dashboard describe secret $(kubectl -n kubernetes-dashboard get secret | grep admin-user | awk '{print $1}')
Name:         admin-user-token-fb742
Namespace:    kubernetes-dashboard
Labels:       <none>
Annotations:  kubernetes.io/service-account.name: admin-user
              kubernetes.io/service-account.uid: 46d6fe53-53c9-11ea-8681-fa163ee0afdc

Type:  kubernetes.io/service-account-token

Data
====
ca.crt:     1017 bytes
namespace:  20 bytes
token:      __DELETED__

C02XD1G9JGH7:.kube davidyuan$ kubectl proxy &
[1] 90298
C02XD1G9JGH7:.kube davidyuan$ Starting to serve on 127.0.0.1:8001
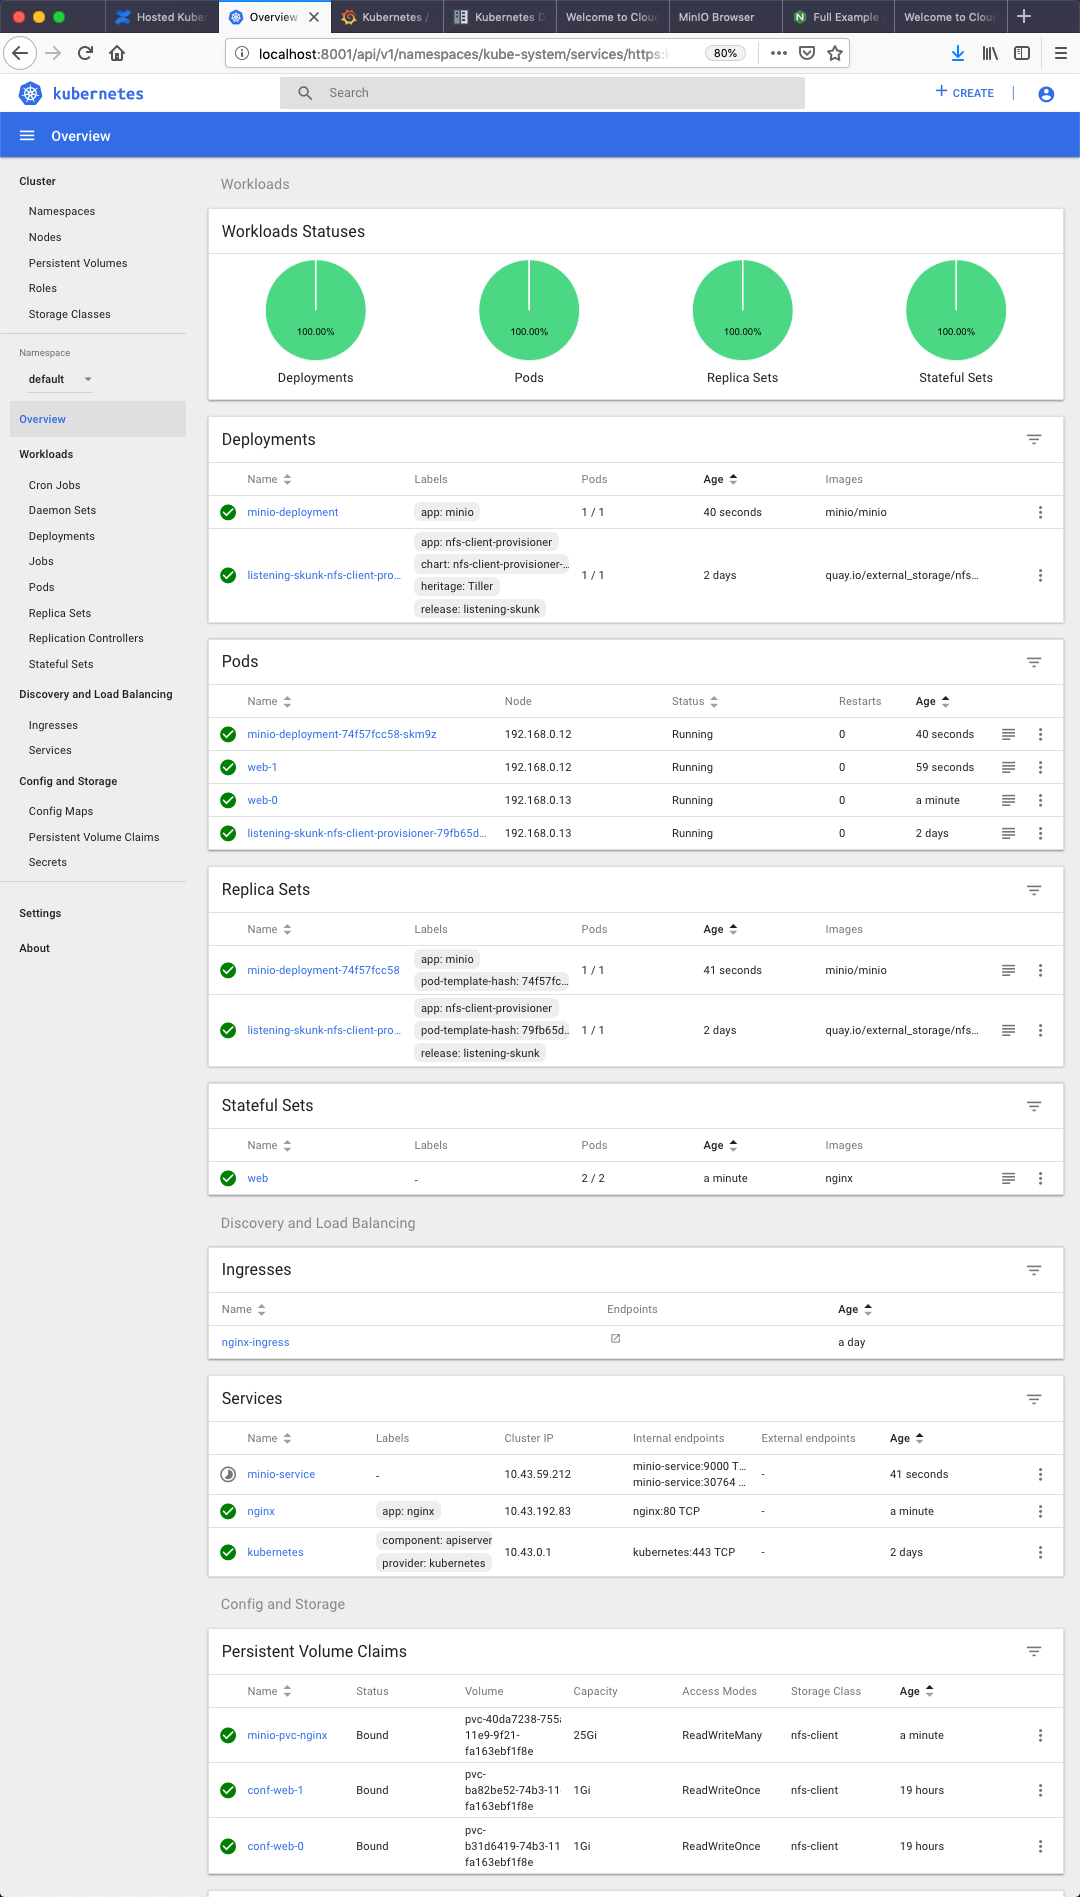
Now you can access the dashboard as if it is running on the local client http://localhost:8001/api/v1/namespaces/kubernetes-dashboard/services/https:kubernetes-dashboard:/proxy/. It is more efficient to check the status of a lot of resource together on the dashboard sometimes.
Prometheus and Grafana
A resource monitor is created specific to your cluster for you, where Prometheus provides data source and Grafana presents information in GUI. Run the following command to get the correct NodePort:
C02XD1G9JGH7:tsi-ccdoc davidyuan$ kubectl get svc --namespace monitoring
NAME                                           TYPE        CLUSTER-IP      EXTERNAL-IP   PORT(S)             AGE
alertmanager-operated                          ClusterIP   None            <none>        9093/TCP,6783/TCP   86d
prometheus-operated                            ClusterIP   None            <none>        9090/TCP            86d
prometheus-operator-alertmanager               ClusterIP   10.43.172.51    <none>        9093/TCP            86d
prometheus-operator-grafana                    ClusterIP   10.43.15.32     <none>        80/TCP              86d
prometheus-operator-grafana-custom             NodePort    10.43.205.187   <none>        3000:30002/TCP      86d
prometheus-operator-kube-state-metrics         ClusterIP   10.43.167.241   <none>        8080/TCP            86d
prometheus-operator-operator                   ClusterIP   10.43.201.240   <none>        8080/TCP            86d
prometheus-operator-prometheus                 ClusterIP   10.43.118.118   <none>        9090/TCP            86d
prometheus-operator-prometheus-custom          NodePort    10.43.21.250    <none>        9090:30986/TCP      86d
prometheus-operator-prometheus-node-exporter   ClusterIP   10.43.179.232   <none>        9100/TCP            86d
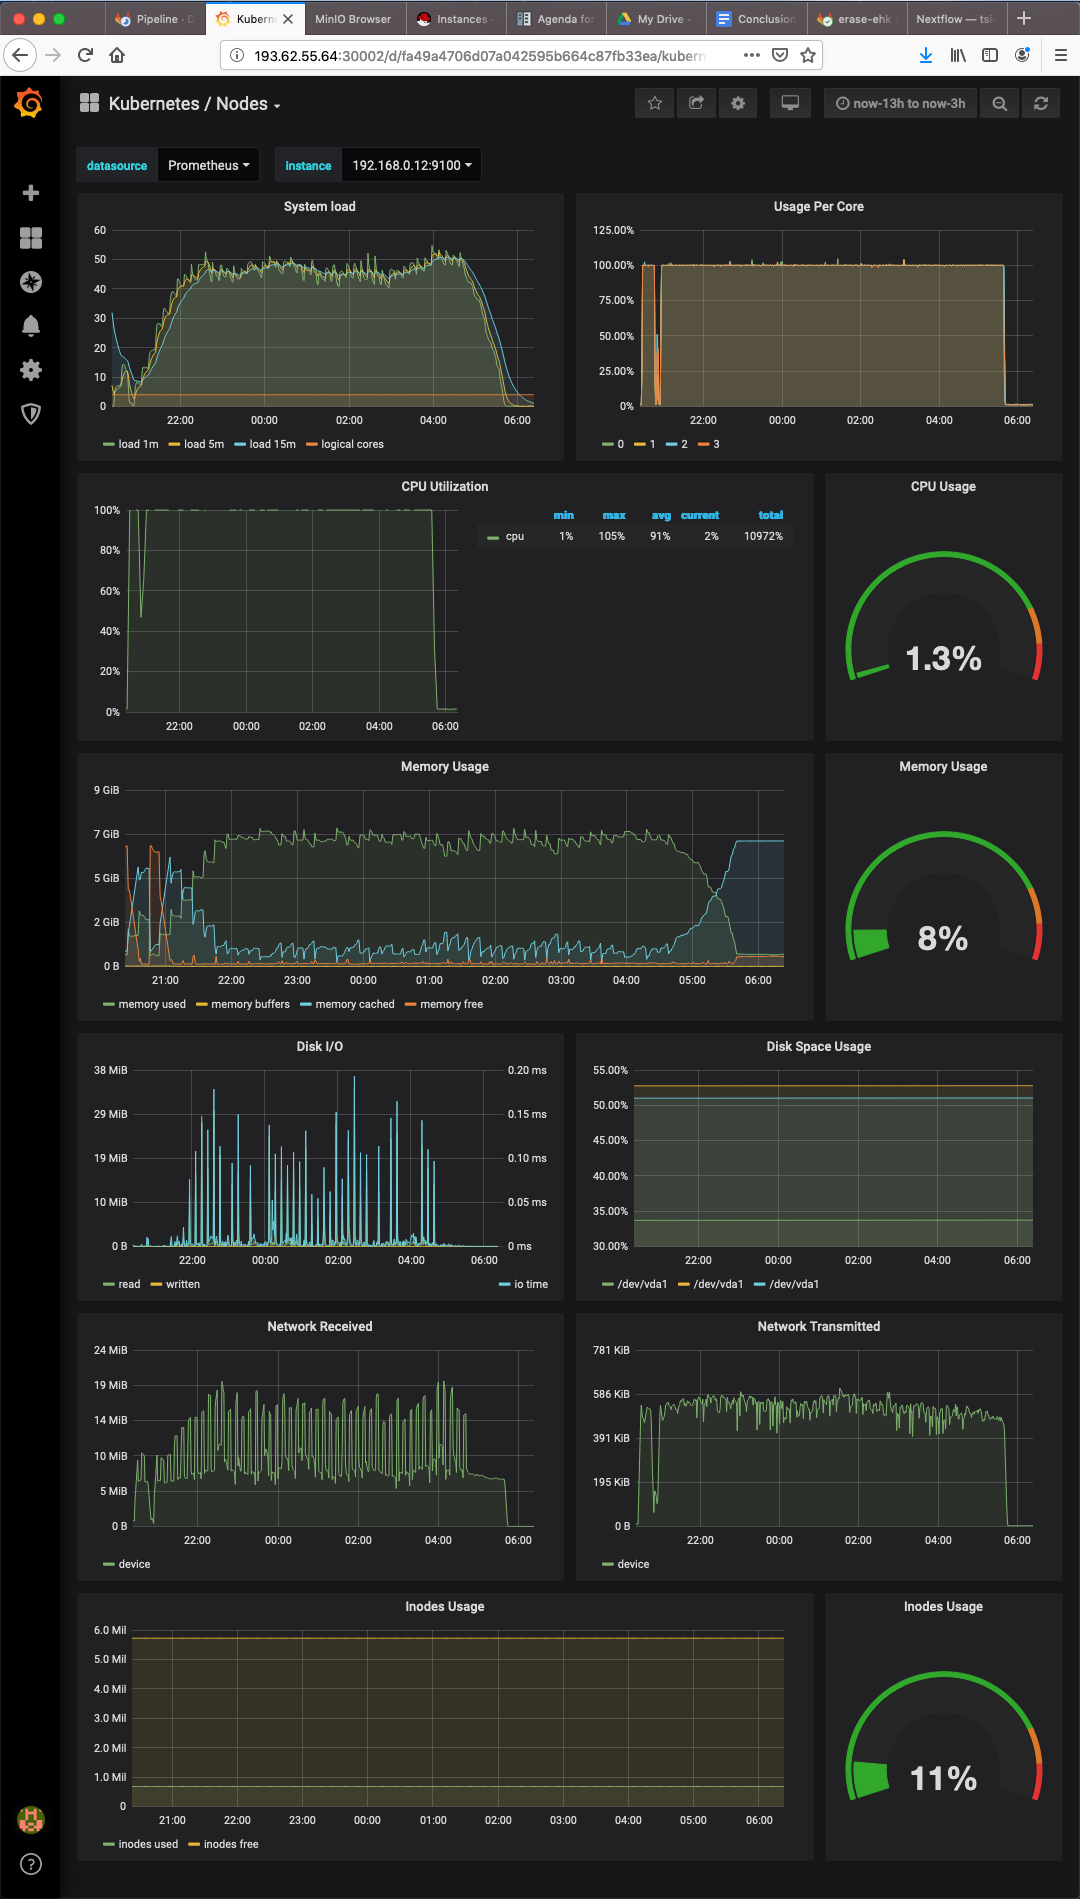
Combining with FIP from kube.yml, you can access the monitor at http://45.86.170.94:30002/login.
There are many useful dashboards built for you already. The most frequently used one is Kubernetes / Nodes. It provides very good overview on resource consumption, for example:
Application for web (NGINX)
NGINX stateful set demonstrates typical architecture of web frontend in Kubernetes. It consists of three components:
- A stateful set of web server pods
- A clusterIP service to distribute loads to the pods
- An ingress to enable access from external network
This tutorial is modified from a Kubernetes tutorial https://kubernetes.io/docs/tutorials/stateful-application/basic-stateful-set/.
Stateful set and service for NGINX
A stateful set always requires a service. They are typically included in the same manifest file. Create and explore the stateful set and its service in CLI or dashboard GUI:
C02XD1G9JGH7:tsi-ccdoc davidyuan$ kubectl apply -f https://gitlab.ebi.ac.uk/TSI/tsi-ccdoc/raw/master/tsi-cc/ResOps/scripts/nginx/web.yml
service/nginx created
statefulset.apps/web created

C02XD1G9JGH7:tsi-ccdoc davidyuan$ kubectl get service nginx
NAME      TYPE        CLUSTER-IP   EXTERNAL-IP   PORT(S)   AGE
nginx     ClusterIP   10.43.32.1   <none>        80/TCP    100s

C02XD1G9JGH7:tsi-ccdoc davidyuan$ kubectl get statefulset web
NAME      READY     AGE
web       2/2       2m35s

C02XD1G9JGH7:tsi-ccdoc davidyuan$ kubectl get pvc -l app=nginx
NAME        STATUS    VOLUME                                     CAPACITY   ACCESS MODES   STORAGECLASS   AGE
www-web-0   Bound     pvc-2ba8d5a1-742f-11e9-9f21-fa163ebf1f8e   1Gi        RWO            nfs-client     9m2s
www-web-1   Bound     pvc-318d02b3-742f-11e9-9f21-fa163ebf1f8e   1Gi        RWO            nfs-client     8m52s

C02XD1G9JGH7:tsi-ccdoc davidyuan$ kubectl get pods -w -l app=nginx
NAME      READY     STATUS    RESTARTS   AGE
web-0     1/1       Running   0          3m
web-1     1/1       Running   0          2m
Ingress to expose service externally
Create an ingress so that the cluster IP gets exposed to the external network:
C02XD1G9JGH7:tsi-ccdoc davidyuan$ kubectl apply -f https://gitlab.ebi.ac.uk/TSI/tsi-ccdoc/raw/master/tsi-cc/ResOps/scripts/nginx/ingress.yml
ingress.extensions/nginx-ingress created

C02XD1G9JGH7:tsi-ccdoc davidyuan$ kubectl get ingress
NAME            HOSTS     ADDRESS   PORTS     AGE
nginx-ingress   *                   80        26s
Now the NGINX is accessible via the the same floating IP for other endpoints, which is provided in kube.yml. In my cluster, the URL is http://45.86.170.94/nginx/.
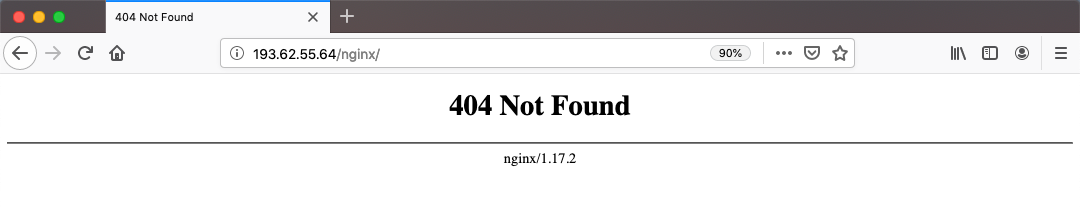
It is understandable that HTTP404 is returned. We did not define a homepage. There is nothing for the web servers to serve.
Data Loading via S3 (Minio)
Your pipeline should always consider using data in its currently location via a native protocol: S3, FTP, SFTP etc.. Check the official documentation by Kubernetes for storage classes for a specific file system. If you have to move it into new block storage with NFS facade, Minio can be considered. This utility adds S3 support to a POSIX file system, including NFS mount. For simplicity, a standalone Minio with a single volume is used. Check Minio documentation for distributed servers for production. There is another demo to elaborate on that.
Minio deployment and service
Create Minio deployment and service. Check if everything is started successfully:
C02XD1G9JGH7:minio davidyuan$ accesskey=__DELETED__
C02XD1G9JGH7:minio davidyuan$ secretkey=__DELETED__
C02XD1G9JGH7:tsi-ccdoc davidyuan$ kubectl create secret generic minio --from-literal=accesskey=${accesskey} --from-literal=secretkey=${secretkey}
secret/minio created

C02XD1G9JGH7:tsi-ccdoc davidyuan$ kubectl get secret
NAME                                                 TYPE                                  DATA   AGE
default-token-x66s8                                  kubernetes.io/service-account-token   3      87d
listening-skunk-nfs-client-provisioner-token-nsggj   kubernetes.io/service-account-token   3      87d
minio                                                Opaque                                2      0s

C02XD1G9JGH7:tsi-ccdoc davidyuan$ kubectl apply -f https://gitlab.ebi.ac.uk/TSI/tsi-ccdoc/raw/master/tsi-cc/ResOps/scripts/minio/minio.yml
deployment.apps/minio-nginx created
service/minio-nginx created

C02XD1G9JGH7:tsi-ccdoc davidyuan$ kubectl get deployment
NAME                                     READY     UP-TO-DATE   AVAILABLE   AGE
listening-skunk-nfs-client-provisioner   1/1       1            1           47h
minio-nginx                              1/1       1            1           63s

C02XD1G9JGH7:~ davidyuan$ kubectl get svc
NAME          TYPE        CLUSTER-IP      EXTERNAL-IP   PORT(S)          AGE
kubernetes    ClusterIP   10.43.0.1       <none>        443/TCP          81d
minio-nginx   NodePort    10.43.151.136   <none>        9000:30968/TCP   52s
nginx         ClusterIP   10.43.173.206   <none>        80/TCP           30m
Note the NodePort. It is needed to access the web UI via the floating IP, for example http://45.86.170.94:30968/. Login with the access key and secret key specified in minio.yml. Upload files via GUI. Follow Minio documentation to use REST interface to load large number of files.
Deleting Minio after using it for better security
Normally, delete Minio after using it for better security. The persistent volume should be kept to be used by other applications such as NGINX. The Minio can be recreated with the same script and mounted to the same volume. The NodePort may be different:
C02XD1G9JGH7:tsi-ccdoc davidyuan$ kubectl delete -f https://gitlab.ebi.ac.uk/TSI/tsi-ccdoc/raw/master/tsi-cc/ResOps/scripts/minio/minio.yml
deployment.extensions "minio-nginx" deleted
service "minio-nginx" deleted

C02XD1G9JGH7:tsi-ccdoc davidyuan$ kubectl get deployment
NAME                                     READY     UP-TO-DATE   AVAILABLE   AGE
listening-skunk-nfs-client-provisioner   1/1       1            1           47h

C02XD1G9JGH7:tsi-ccdoc davidyuan$ kubectl get svc
NAME         TYPE        CLUSTER-IP   EXTERNAL-IP   PORT(S)   AGE
kubernetes   ClusterIP   10.43.0.1    <none>        443/TCP   47h
nginx        ClusterIP   10.43.32.1   <none>        80/TCP    13h

C02XD1G9JGH7:tsi-ccdoc davidyuan$ kubectl get pvc
NAME             STATUS    VOLUME                                     CAPACITY   ACCESS MODES   STORAGECLASS   AGE
minio-pv-claim   Bound     pvc-4e377e97-74a1-11e9-b4f1-fa163eaf0769   25Gi       RWX            nfs-client     20m
www-web-0        Bound     pvc-2ba8d5a1-742f-11e9-9f21-fa163ebf1f8e   1Gi        RWO            nfs-client     13h
www-web-1        Bound     pvc-318d02b3-742f-11e9-9f21-fa163ebf1f8e   1Gi        RWO            nfs-client     13h

C02XD1G9JGH7:tsi-ccdoc davidyuan$ kubectl get pv
NAME                                       CAPACITY   ACCESS MODES   RECLAIM POLICY   STATUS    CLAIM                                                                                                         STORAGECLASS   REASON    AGE
pvc-00183ff4-7318-11e9-9f21-fa163ebf1f8e   50Gi       RWO            Delete           Bound     monitoring/prometheus-prometheus-operator-prometheus-db-prometheus-prometheus-operator-prometheus-0           nfs-client               47h
pvc-2ba8d5a1-742f-11e9-9f21-fa163ebf1f8e   1Gi        RWO            Delete           Bound     default/www-web-0                                                                                             nfs-client               13h
pvc-318d02b3-742f-11e9-9f21-fa163ebf1f8e   1Gi        RWO            Delete           Bound     default/www-web-1                                                                                             nfs-client               13h
pvc-4e377e97-74a1-11e9-b4f1-fa163eaf0769   25Gi       RWX            Delete           Bound     default/minio-pv-claim                                                                                        nfs-client               20m
pvc-fc23cc6b-7317-11e9-9f21-fa163ebf1f8e   20Gi       RWO            Delete           Bound     monitoring/alertmanager-prometheus-operator-alertmanager-db-alertmanager-prometheus-operator-alertmanager-0   nfs-client               47h
In production, you may want to consider serving static content via REST interface instead of NFS file mount. NGINX would be used as reverse proxy in such web-native archicture. In this case, it is extremely important to choose S3 storage provider carefully for production.
End-to-end: integrating NGINX, NFS and Minio
It is very easy to clean up with Kubernete. Resources created are deleted if the same manifest is provided to the delete command. Note that it is important to follow the correct order to delete resources as one may have dependencies on another.:
C02XD1G9JGH7:tsi-ccdoc davidyuan$ kubectl delete -f https://gitlab.ebi.ac.uk/TSI/tsi-ccdoc/raw/master/tsi-cc/ResOps/scripts/minio/minio.yml
deployment.extensions "minio-nginx" deleted
service "minio-nginx" deleted

C02XD1G9JGH7:~ davidyuan$ kubectl delete -f https://gitlab.ebi.ac.uk/TSI/tsi-ccdoc/raw/master/tsi-cc/ResOps/scripts/nginx/ingress.yml
ingress.extensions "nginx-ingress" deleted

C02XD1G9JGH7:tsi-ccdoc davidyuan$ kubectl delete -f https://gitlab.ebi.ac.uk/TSI/tsi-ccdoc/raw/master/tsi-cc/ResOps/scripts/nginx/web.yml
service "nginx" deleted
statefulset.apps "web" deleted

C02XD1G9JGH7:tsi-ccdoc davidyuan$ kubectl delete -f https://gitlab.ebi.ac.uk/TSI/tsi-ccdoc/raw/master/tsi-cc/ResOps/scripts/nginx/pvc.yml
persistentvolumeclaim "minio-pv-claim" deleted
However, there is an exception by design. Volumes created by stateful set are not deleted when the stateful set itself is deleted. It is designed to be mounted again if the stateful set is created again. Delete them explicitly if needed:
C02XD1G9JGH7:tsi-ccdoc davidyuan$ kubectl get pvc
NAME              STATUS    VOLUME                                     CAPACITY   ACCESS MODES   STORAGECLASS   AGE
www-web-0         Bound     pvc-2ba8d5a1-742f-11e9-9f21-fa163ebf1f8e   1Gi        RWO            nfs-client     15h
www-web-1         Bound     pvc-318d02b3-742f-11e9-9f21-fa163ebf1f8e   1Gi        RWO            nfs-client     15h
Update pvc.yml, minio.yml and web.yml to make sure that the mount points are matched, which must be the parent of the default document root /usr/share/nginx/. The volume is created in ReadWriteMany mode. The storage root for Minio server is changed to the mount point. Note that it is important to follow the correct order to create resources as one may have dependencies on another.:
C02XD1G9JGH7:tsi-ccdoc davidyuan$ kubectl apply -f https://gitlab.ebi.ac.uk/TSI/tsi-ccdoc/raw/master/tsi-cc/ResOps/scripts/nginx/pvc.yml
persistentvolumeclaim/minio-pvc-nginx created

C02XD1G9JGH7:tsi-ccdoc davidyuan$ kubectl apply -f https://gitlab.ebi.ac.uk/TSI/tsi-ccdoc/raw/master/tsi-cc/ResOps/scripts/nginx/web.yml
service/nginx created
statefulset.apps/web created

C02XD1G9JGH7:~ davidyuan$ kubectl apply -f https://gitlab.ebi.ac.uk/TSI/tsi-ccdoc/raw/master/tsi-cc/ResOps/scripts/nginx/ingress.yml
ingress.extensions/nginx-ingress created

C02XD1G9JGH7:tsi-ccdoc davidyuan$ kubectl apply -f https://gitlab.ebi.ac.uk/TSI/tsi-ccdoc/raw/master/tsi-cc/ResOps/scripts/minio/minio.yml
deployment.extensions/minio-nginx created
service/minio-nginx created
Log onto Minio at http://45.86.170.94:30968/, where 30968 is the new NodePort show on GUI. Create a bucket html and place an index.html file in it.
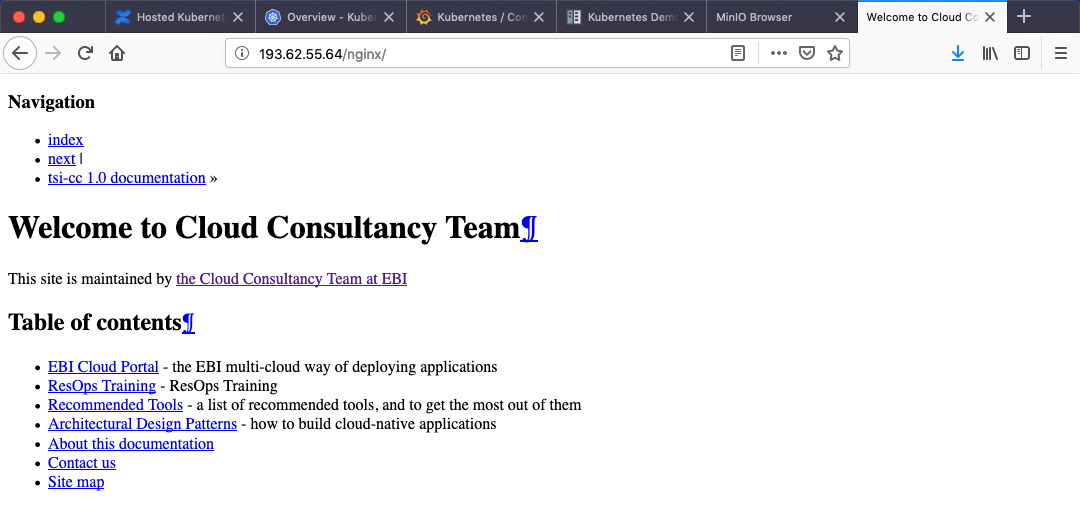
Check NGINX http://45.86.170.94/nginx/. You should see an HTML page without styling instead of HTTP404 error.
If you are curious how the backends work, connect to either one of the three pods: minio-deployment-74f57fcc58-skm9z, web-0 or web-1. You will see NFS mount of /usr/share/nginx. In addition, a subdirectory of html is created by Minio. The index.html uploaded to the html bucket is stored in the subdirectory with the same name:
C02XD1G9JGH7:tsi-ccdoc davidyuan$ kubectl get pod
NAME READY STATUS RESTARTS AGE
listening-skunk-nfs-client-provisioner-79fb65dd79-86qgq 1/1 Running 0 2d22h
minio-nginx-74f57fcc58-skm9z 1/1 Running 0 91m
web-0 1/1 Running 0 91m
web-1 1/1 Running 0 91m
C02XD1G9JGH7:tsi-ccdoc davidyuan$ kubectl exec -it web-0 -- /bin/bash
root@web-0:/# df -h
Filesystem Size Used Avail Use% Mounted on
overlay 49G 3.3G 46G 7% /
tmpfs 64M 0 64M 0% /dev
tmpfs 3.9G 0 3.9G 0% /sys/fs/cgroup
/dev/vda1 49G 3.3G 46G 7% /etc/hosts
shm 64M 0 64M 0% /dev/shm
192.168.0.19:/nfs/default-minio-pvc-nginx-pvc-40da7238-755a-11e9-9f21-fa163ebf1f8e 300G 868M 300G 1% /usr/share/nginx
192.168.0.19:/nfs/default-conf-web-0-pvc-b31d6419-74b3-11e9-9f21-fa163ebf1f8e 300G 868M 300G 1% /usr/share/nginx/conf
tmpfs 3.9G 12K 3.9G 1% /run/secrets/kubernetes.io/serviceaccount
tmpfs 3.9G 0 3.9G 0% /proc/acpi
tmpfs 3.9G 0 3.9G 0% /proc/scsi
tmpfs 3.9G 0 3.9G 0% /sys/firmware
root@web-0:/# ls -l /usr/share/nginx
total 0
drwxrwxrwx 2 root root 6 May 12 12:44 conf
drwxr-xr-x 2 root root 24 May 13 09:12 html
root@web-0:/# ls -l /usr/share/nginx/html/
total 32
-rw-r--r-- 1 root root 30802 May 13 09:12 index.html
root@web-0:/# head /usr/share/nginx/html/index.html
<!DOCTYPE html PUBLIC "-//W3C//DTD XHTML 1.0 Transitional//EN"
"http://www.w3.org/TR/xhtml1/DTD/xhtml1-transitional.dtd">
<html xmlns="http://www.w3.org/1999/xhtml">
<head>
<meta http-equiv="X-UA-Compatible" content="IE=Edge" />
<meta http-equiv="Content-Type" content="text/html; charset=utf-8" />
<title>Welcome to Cloud Consultancy Team — tsi-cc 1.0 documentation</title>
<link rel="stylesheet" href="_static/classic.css" type="text/css" />
By the way, the same index.html can also be accessed via S3. Here is what the link may look like:
http://45.86.170.94:30968/html/index.html?X-Amz-Algorithm=AWS4-HMAC-SHA256&X-Amz-Credential=davidyuan%2F20190513%2F%2Fs3%2Faws4_request&X-Amz-Date=20190513T102759Z&X-Amz-Expires=604800&X-Amz-SignedHeaders=host&X-Amz-Signature=297542c0b696b6980acd9252e35da7604623006334ef9b20d028c7b736217ae8
The metadata for S3 protocol can be found under /usr/share/nginx/.minio.sys:
root@web-0:/usr/share/nginx/.minio.sys# ls -la
total 4
drwxr-xr-x 6 root root 82 May 13 09:12 .
drwxrwxrwx 5 root root 48 May 13 09:11 ..
drwxr-xr-x 3 root root 18 May 13 09:12 buckets
drwxr-xr-x 2 root root 25 May 13 08:37 config
-rw------- 1 root root 94 May 13 08:37 format.json
drwxr-xr-x 2 root root  6 May 13 08:37 multipart
drwxr-xr-x 3 root root 50 May 13 08:37 tmp